What’s more important: in-store vs on-shelf availability?
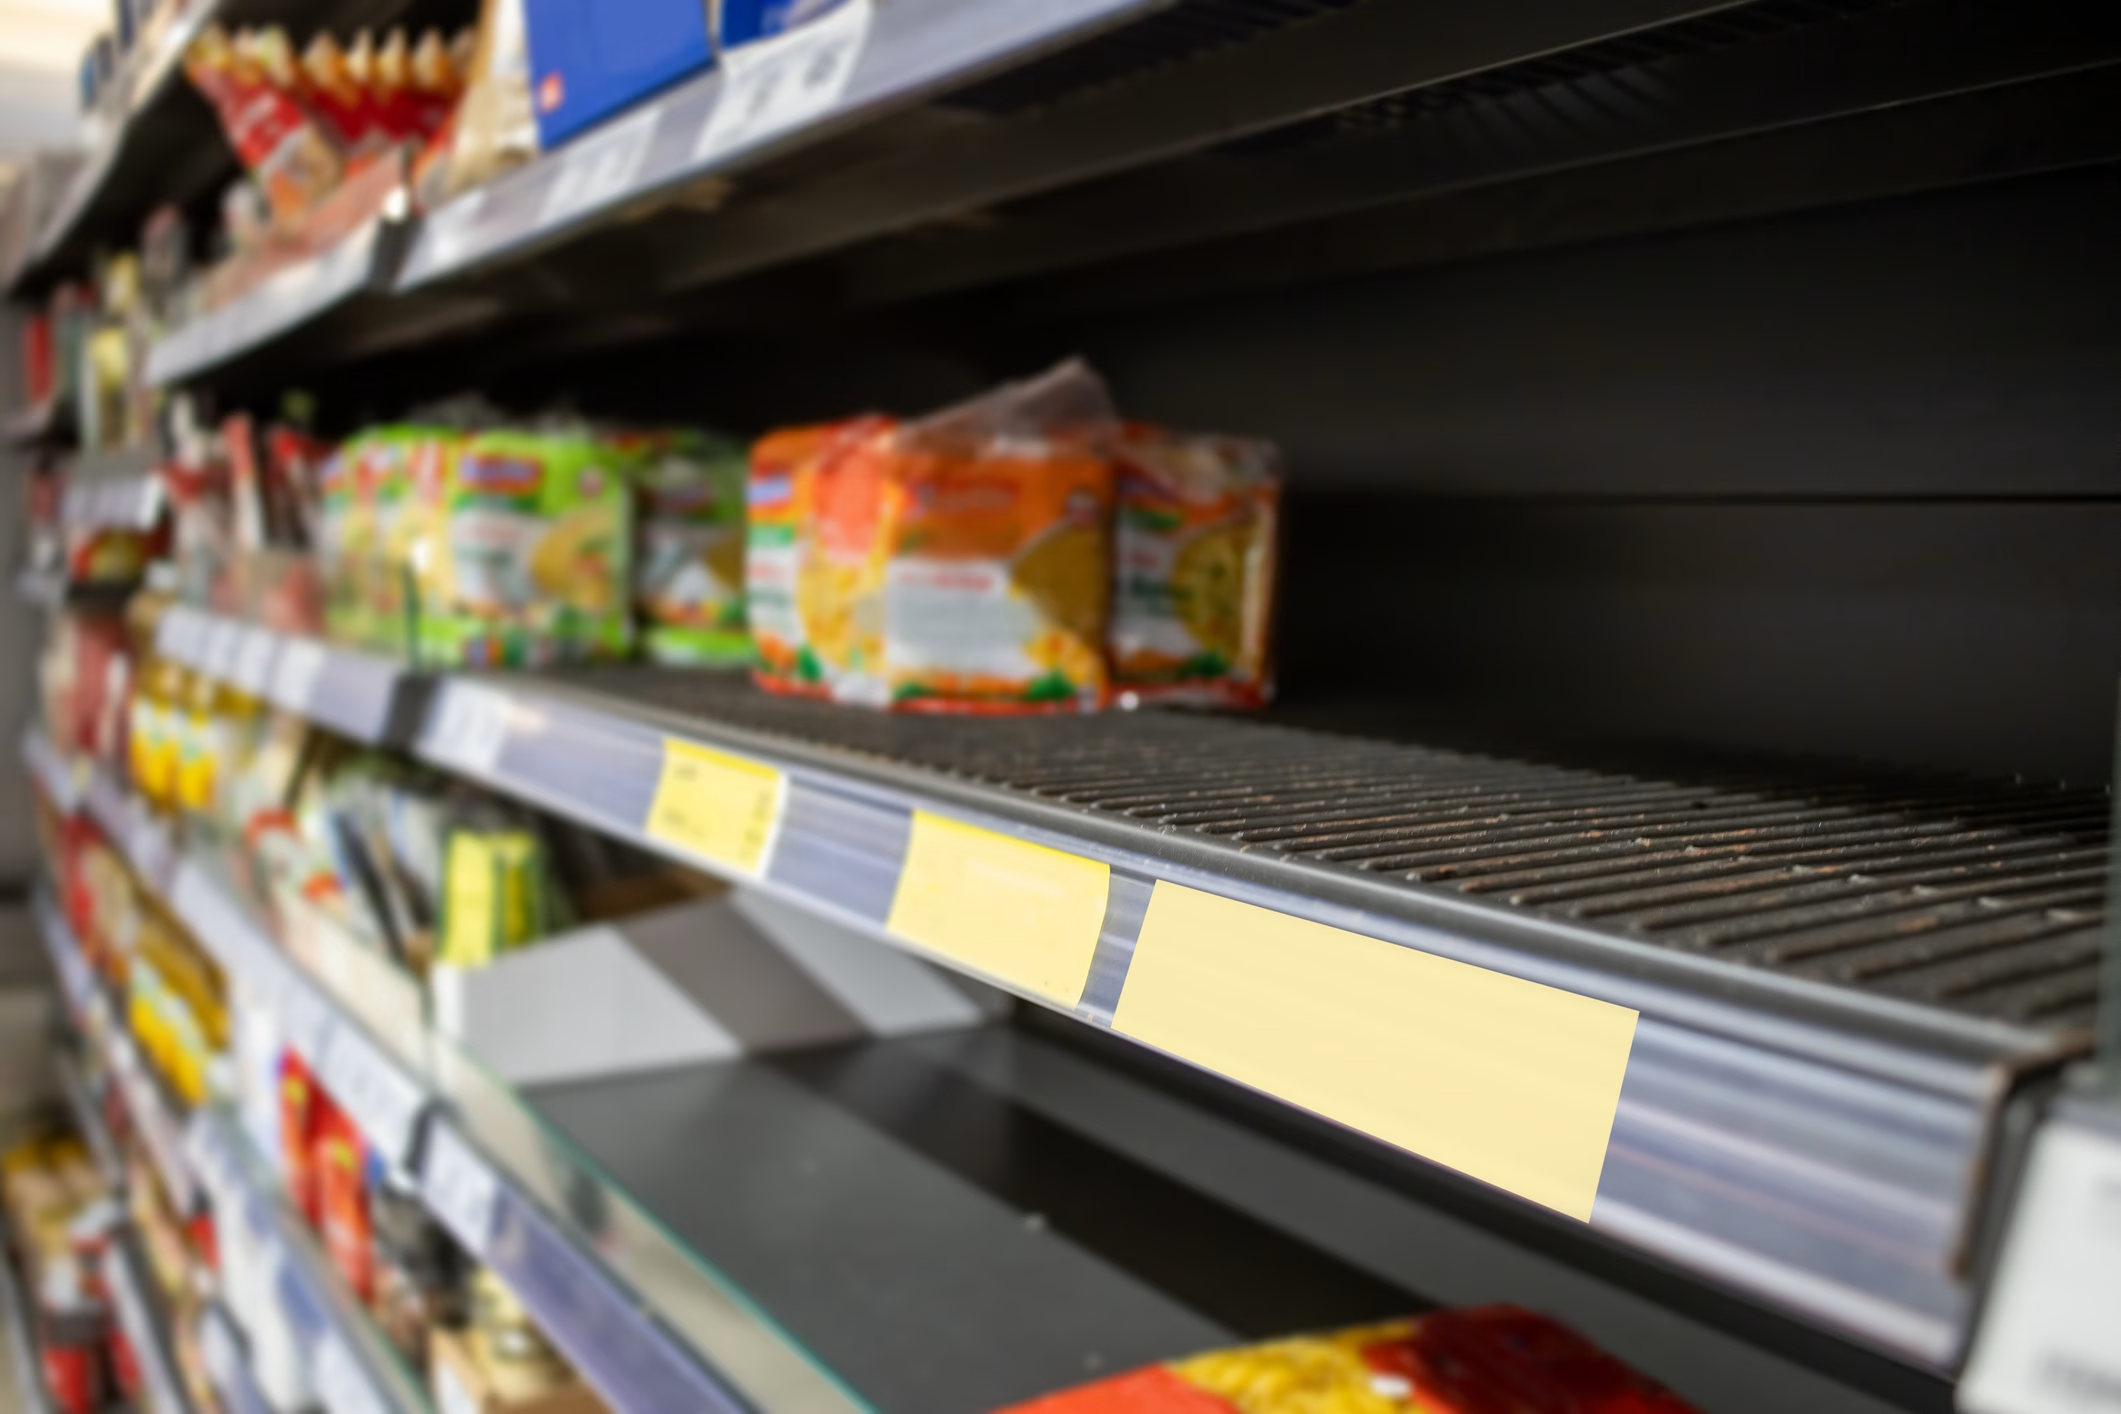
Ultimately, on-shelf availability is more important to measure and understand than in-store availability – because (in most cases) shoppers can only purchase what’s available on the shelf. That said, both have a part to play; let’s explore further…
What do we mean by availability?
Most retailers would argue that for a product to be considered available it must be:
- physically present on the shelf;
- in a presentable (undamaged) form; and,
- correctly labelled and priced.
By this definition, “available stock” at any point in time, at a particular location, is a count of the number of presentable, correctly-priced-and-labelled products on the shelf. This sounds credible but is actually pretty hard to measure reliably. Consider the following scenarios:
- No items on the shelf; clearly unavailable
- Two items on the shelf, both presented in damaged packaging; available?
- Three items, all reduced in price with today’s date as the sell-by-date: available?
- Five items on the wrong shelf, with an inaccurate price and label: available?
Some of these may appear extreme but they represent common edge cases for slower-moving items, promotional lines (at end of promotion), new product variants etc. In reality, most retailers assume that the presence of at least one unit of an item on the shelf is enough to mark it as available.
How can we measure availability?
With tens of thousands of items on the shelves of a large format supermarket, how can we accurately measure stock levels and ‘availability’? Traditionally, there are several approaches that retailers use:
- Gap scan: where store staff patrol shelves looking for gaps and scanning, with a handheld device, any shelf-edge label where stock is unavailable.
- Pros: definite record of unavailable items
- Cons: labour-intensive (dedicated process), point-in-time data capture, incomplete record (not all shelves are scanned all of the time)
- In-store pick: where store staff record a failure to pick an item from the shelf for an online order.
- Pros: definite record of unavailable items, part of an existing process (lower overhead)
- Cons: incomplete record (only covers items ordered), point-in-time data capture
- Sales velocity (probability): where sales volumes are compared to expected patterns and items marked as unavailable where they fail to sell for an extended period.
- Pros: continuously available (if desired), complete coverage
- Cons: probabilistic (not definite), performs poorly for slow-moving products, un-validated
What’s the difference between “on-shelf” and “in-store”?
All of the approaches above focus on “on-shelf availability” – the physical presence of appealing, labelled, priced products on the shelf, ready for shoppers to select and purchase.
Measuring the total stock of each item within a location is (at least theoretically) a lot easier:
- EPOS systems know how many units have been sold, and at what price
- Stock systems know how many units were available at the last stock check, and what delivered has been received since
- Total stock at location, for every item, is as simple as:
Current Stock = Opening Stock + Sum of all Deliveries
– Sum of all Sales
Shortly after a stock take, the current stock calculation is highly accurate but degrades over time due to:
- waste and damage;
- shrinkage (e.g. theft); and,
- data errors (e.g. miscoding).
If we accept that we’re always subject to data errors (however we measure anything) then we can amend our calculation as follows:
Current Stock = Opening Stock + Sum of all Deliveries
– Sum of all (Sales + Waste + Damages + Shrink)
The more measurements, based on data captured in different systems (EPOS, waste management, stock recording etc.), the more likely errors creep in BUT this is still an active, rolling measure that can be calculated and updated at any time; as long as we know the opening position, and all movements (sales, damages etc.) we have an accurate picture of the total units of stock in the store.
Why would the on-shelf measure differ from in-store?
Most retail stores have some space allocated to a storeroom, used to hold stock where more has been delivered than can fit on the shelf. This is useful – it creates a buffer to allow staff to restock the shelves between delivered. Used correctly, in a well-maintained store, the buffer stock increases on-shelf availability because shelves can be restocked as units are sold.
Unfortunately, not all stores replenish shelves as fast as shoppers empty them – at least for some product lines – and so “on-shelf” availability can hit zero (an “out-of-stock incident”) despite the store having more stock in the storeroom. In a well-managed, full-staffed store every gap is spotted quickly and replenished… but when staff levels are low, or management distracted, shelves can go un-replenished for hours or days, leaving shoppers and suppliers frustrated.
So… which is more important to measure?
It’s valuable to measure both, where retailers provide the data:
- “On-shelf” measurements get closer to the shopper experience but limitations in the way this data is captured, or synthesised, mean that “on-shelf availability” is better considered an indicator than an accurate measure
- “In-store” measurements are usually more accurate and more actionable as a supplier; you can encourage retailers to order more, and monitor in-store stock levels more closely, but you’re unlikely to be able to persuade them to change staffing levels or commit that every store will restock shelves as you would want
Further reading on Availability:
Fixing on-shelf availability, together

